ZigZag
The Basics
The ZigZag is not an indicator per se, but is a line to filter out smaller price movements.
Indicator Type
Trend follower
Markets
All cash and futures, not options
Works Best
Trending markets
Formula
Filtering out smaller movements gives chartists the ability to see the forest instead of just trees.
Parameters

A ZigZag set at 10% would ignore all price movements less than 10%. Only price movements greater than 10% would be shown. A ZigZag based on the high-low range is more likely to change course than a ZigZag based on the close because the high-low range will be much larger and produce bigger swings.
Theory
Chartists can also use the ZigZag with retracements feature to identify Fibonacci retracements and projections. A ZigZag(10) will filter out movements less than 10%. If a stock traded from a reaction low of 100 to a high of 109 (+9%), there would not be a line because the move was less than 10%. If the stock advanced from a low of 100 to a high of 110 (+10%), there would be a line from 100 to 110. If the stock continued on to 112, this line would extend to 112 (100 to 112). The ZigZag would not reverse until the stock declined 10% or more from its high. From a high of 112, a stock would have to decline 11.2 points (or to a low of 100.8) to warrant another line.
Interpretation

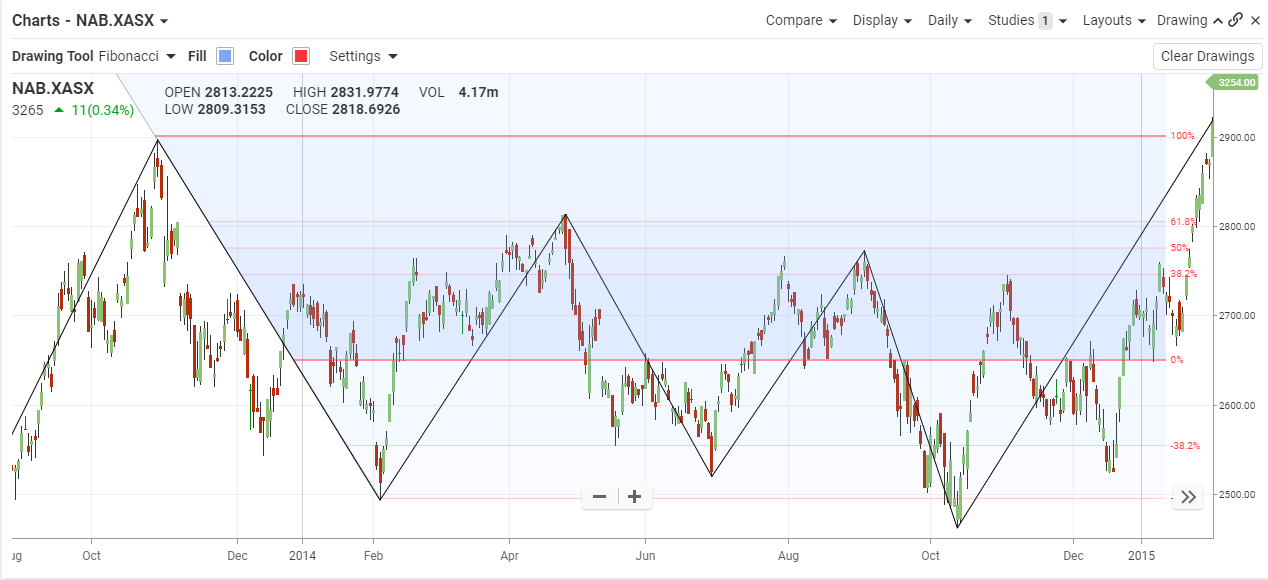
National Australia Bankrallied in early 2014 but hit the 61.8% retracement forming a bearish divergence. It was a good sign for traders to take profits ahead of the fall.
In October 2014, it dropped well below the -38% retracement which suggested a correction and it had choppy movement before bouncing again on the -38% retracement before taking a definite bullish trend.
