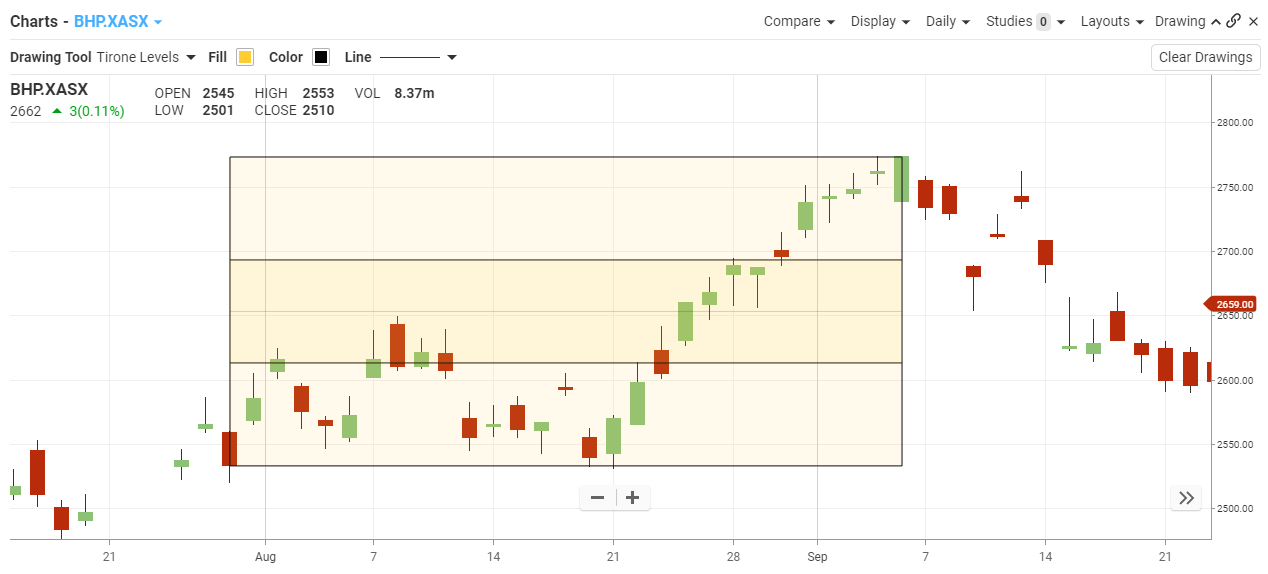
Tirone Levels
The Basics
Tirone Levels are a series of horizontal lines that identify support and resistance levels. They were developed by John Tirone
Indicator Type
Resistance Levels
Markets
All cash and futures, not options
Works Best
All markets and time frames although this study can excel in determining if a visually flat market is starting to develop a trend.
Formula
Midpoint Method
Midpoint levels are calculated by finding the highest high and the lowest low during the time period being analysed. The lines are then calculated as follows:
- Top line:
Subtract the lowest low from the highest high, divide this value by three, and then subtract this result from the highest high.
- Center Line:
Subtract the lowest low from the highest high, divide this value by two, and then add this result to the lowest low.
- Bottom Line:
Subtract the lowest low from the highest high, divide this value by three, and then add this result to the lowest low.
Mean Method
Mean levels are displayed as five lines (the spacing between the lines is not necessarily symmetrical). The lines are calculated as follows:
- Extreme High:
Subtract the lowest low from the highest high and add this value to the Adjusted Mean.
- Regular High:
Subtract the lowest low from the value of the Adjusted Mean multiplied by two.
- Adjusted Mean:
This is the sum of the highest high, the lowest low, and the most recent closing price, divided by three.
- Regular Low:
Subtract the highest high from the value of the Adjusted Mean multiplied by two.
- Extreme Low:
Subtract the lowest low from the highest high and then subtract this value from the Adjusted Mean
Parameters
none
Theory
The use of Tirone levels is similar to that of Fibonacci retracement, and both are interpreted in the same way. They both determine the position of the lines by using a percentage of the difference between a high and a low. Both Tirone levels and Fibonacci retracement use 50% as one of the possible support/resistance levels.
Interpretation
Tirone Levels can be drawn using either the Midpoint 1/3-2/3 method or the Mean method. Both methods are intended to help you identify potential support and resistance levels based on the range of prices over a given time period. The interpretation of Tirone Levels is similar to Quadrant Lines.

