Retracement
The Basics
Fibonacci retracement is created by taking two extreme points (usually a major peak and trough).
Indicator Type
Resistance Levels
Markets
All cash and futures, not options
Works Best
All markets and time frames although this study can excel in determining if a visually flat market is starting to develop a trend.
Formula
The Fibonacci sequence of numbers is as follows: 0, 1, 1, 2, 3, 5, 8, 13, 21, 34, 55, 89, 144, etc. Each term in this sequence is simply the sum of the two preceding terms and the sequence continues infinitely. One of the remarkable characteristics of this numerical sequence is that each number is approximately 1.618 times greater than the preceding number. This common relationship between every number in the series is the foundation of the common ratios used in retracement studies.
The key Fibonacci ratio of 61.8% – also referred to as “the golden ratio” or “the golden mean” – is found by dividing one number in the series by the number that follows it. For example: 8/13 = 0.6153, and 55/89 = 0.6179.
The 38.2% ratio is found by dividing one number in the series by the number that is found two places to the right. For example: 55/144 = 0.3819.
The 23.6% ratio is found by dividing one number in the series by the number that is three places to the right. For example: 8/34 = 0.2352.
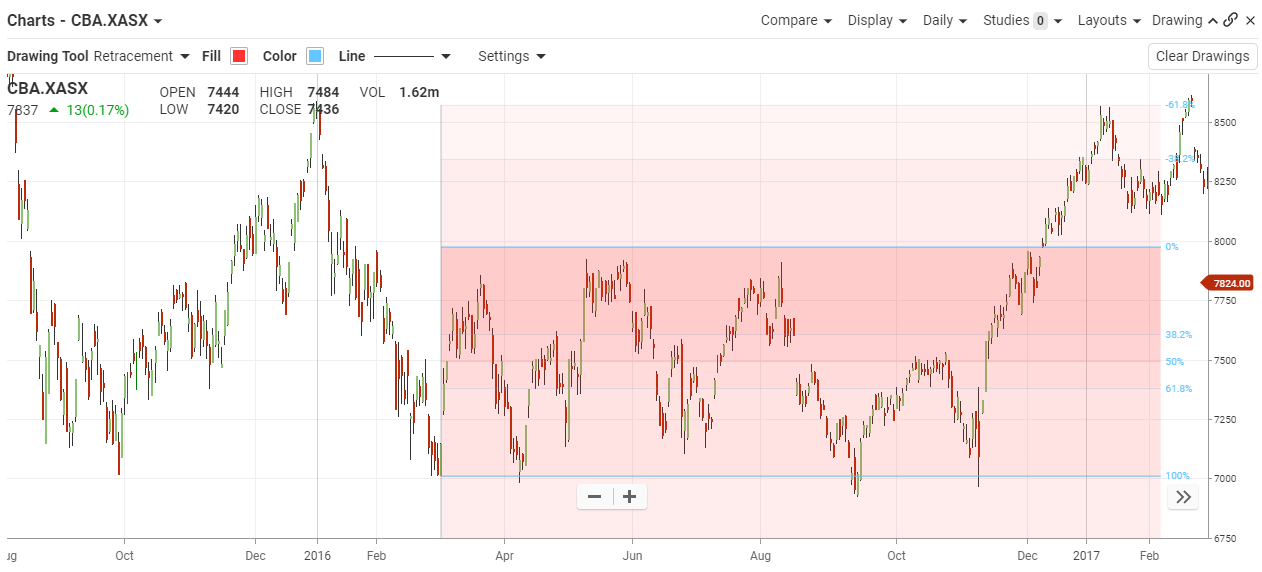
For reasons that are unclear, these ratios seem to play an important role in the stock market, just as they do in nature, and can be used to determine critical points that cause an asset’s price to reverse. The direction of the prior trend is likely to continue once the price of the asset has retraced to one of the ratios listed above. The following chart illustrates how Fibonacci retracement can be used. Notice how the price changes direction as it approaches the support/resistance levels.
Parameters

Theory
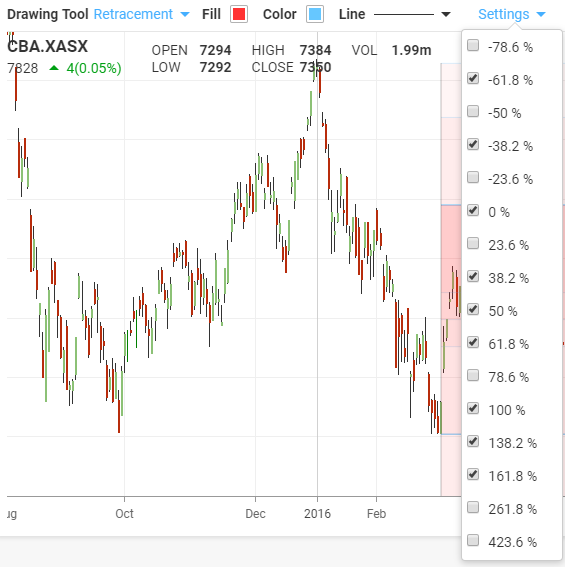
Fibonacci retracement is created by taking two extreme points (usually a major peak and trough) on a stock chart and dividing the vertical distance by the key Fibonacci ratios of 23.6%, 38.2%, 50%, 61.8% and 100%. Once these levels are identified, horizontal lines are drawn and used to identify possible support and resistance levels. Before we can understand why these ratios were chosen, we need to have a better understanding of the Fibonacci number series.
Interpretation

Fibonacci retracements are often used to identify the end of a correction or a counter-trend bounce. Corrections and counter-trend bounces often retrace a portion of the prior move. While short 23.6% retracements do occur, the 38.2-61.8% covers the more possibilities (with 50% in the middle). This zone may seem big, but it is just a reversal alert zone. Other technical signals are needed to confirm a reversal. Reversals can be confirmed with candlesticks, momentum indicators, volume or chart patterns. In fact, the more confirming factors the more robust the signal.
