Positive Volume Index
The Basics
The Positive Volume Index (or PVI) is a momentum indicator that dwells on the measurement of price changes. It was developed by the seasonal traders Norman Fosback and Paul Dysart. It allows analysis of the trading activity, as well as market noise on market conditions. It comes in especially useful on days when today’s volume exceeds yesterday’s volume.
A factor that contributes to the reliability of the Positive Volume Index is its preference for days with higher trading volume. It follows that when the indicator is up, it is a signal to start selling; it implies that the prices on the forex market are appreciating. Conversely, if the indicator is low, it implies that the prices are depreciating, which makes it an ideal day to be a buyer.
Indicator Type
Trend Follower
Markets
All cash and futures, not options
Works Best
Trending markets
Formula
The calculation for the Positive Volume Index can be quite lengthy compared to other calculations for forex trading indicators; it requires three values:
- Yesterday’s PVI
- Today’s closing price, and
- Yesterday’s closing price.
First, take today’s closing price and from it, and subtract yesterday’s closing price. Then, divide the result by yesterday’s closing price. Next, multiply the quotient with yesterday’s PVI. And finally, add yesterday’s closing price to the product.
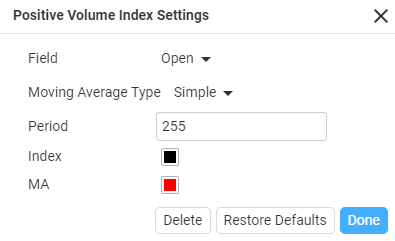
Parameters

Theory
Up Volume
If a stock closed at a price higher than the previous day’s close, the share volume for that day would be considered up volume. Quite often, market participants refer to a day of overall market up volume as a day of bullish volume, due to an overall bullish sentiment sending markets up. Typically, however, days of down volume are heavier in terms of overall volume than up days.
Down Volume
If a stock closed at a price lower than the previous day’s close, the share volume for that day would be considered down volume. Quite often market participants refer to a day of overall market down volume as a day of bearish volume, due to an overall bearish sentiment sending markets down. Typically, days of down volume are heavier in terms of overall volume than up days.
Interpretation

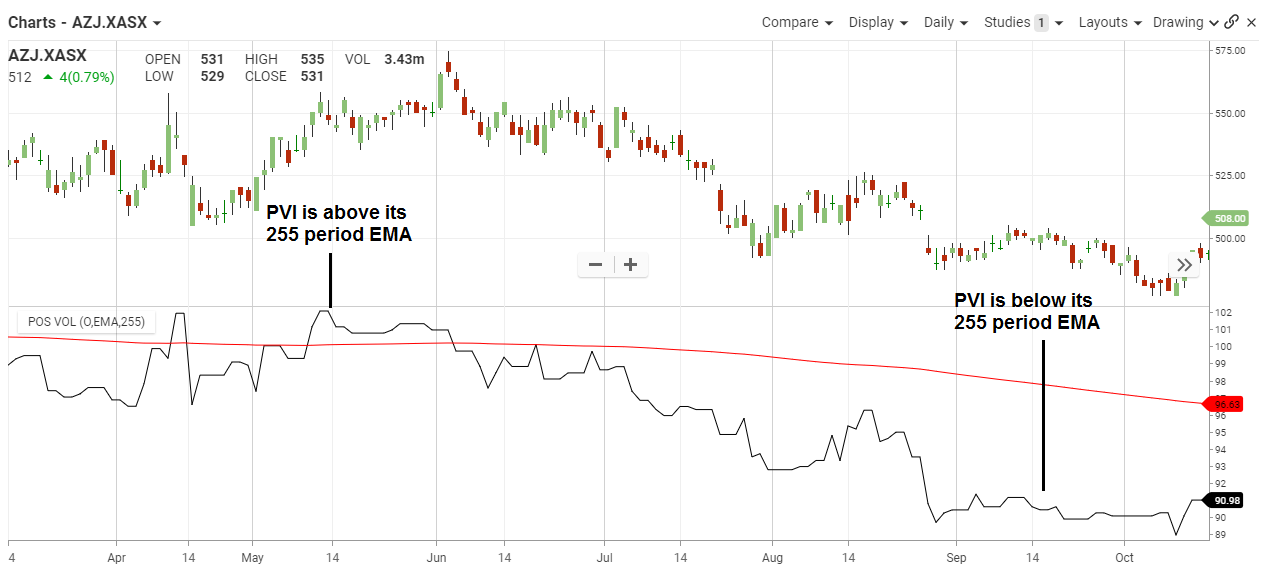
On the Aurion Holding chart in May 2014positive volume index climbed above the 255 EMA, this signalled a gradual reversal from oversold. It crossed in June 2014 under 255 EMA and the price trended down as the positive volume gapped further down, going to an oversold trend.
Maths
PVI = {yesterday’s PVI X [(today’s CP – yesterday’s CP) ÷ yesterday’s CP]} + yesterday’s PVI
