RSI
The Basics
RSI (Relative Strength Index) is used to measure underlying strength of a market move.
Indicator Type
Momentum oscillator
Markets
All cash and futures, not options
Works Best
Trending markets, all time frames
Formula
The RSI looks at a ratio of average size of the up-closes over the past “n” periods and compares to the average size of the down-closes. The result is indexed between 0 and 100.
RSI values are smoothed exponentially using the same “n” period parameter.
Parameters

Parameters are based on personal preference, but these are common starting points for each asset class. For quicker analysis, parameters can be smaller. For slower analysis, parameters can be larger.
- Foreign Exchange: 5, 9
- Fixed Income: 9
- Stocks: 14
- Index: 9, 14
- Commodities: 14
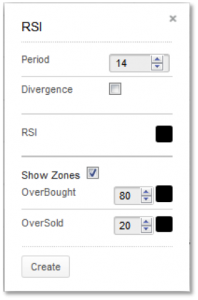
Technician defaults to a period of 14. If the “divergence” box is checked the software identifies possible conditions of price moving one way and RSI moving the other.
The “Show Zone” box allows the user to draw overbought and oversold lines on the plot. They default to 80 for overbought and 20 for oversold but can be changed by the user.
You can also select colour for the RSI plot and two zone lines by selecting the boxes next to each to bring up a colour palette.
Theory
Prices are generally considered to be elastic in that they can move only so far from a mean price before reacting or retracing. The slope and values of the RSI are directly proportional to the velocity and magnitude of the price move and are extremely helpful in identifying overbought and oversold situations.
The number of periods (days, hours, 5-minutes) was originally based on half of a normal cycle. For example, Welles Wilder originally presumed Gold to have a 28-day cycle so a 14-day RSI was used. This has been replaced by the speed of the market. Faster markets use smaller (more sensitive) parameters.
Interpretation

The RSI value itself ranges from 0 to 100 and support, resistance and trends can be found on the RSI plot. An RSI value above 80 indicates a possible overbought situation and a value below 20 indicates a possible oversold condition. This does not mean, however, that a market will immediately reverse once either of these levels is reached. It is more likely that the market will pause to consolidate, resulting in a more neutral RSI value.
Relatively high RSIs (60-80) normally accompany a rising trend and relatively low RSIs (20-40) normally accompany a declining price trend. If price makes a higher high and RSI makes a lower high, the divergence between the two could signal bearish market reversals. Conversely, a lower low in price and higher low in RSI could signal a bullish market reversal.
AMP stock was in a strong rising trend until it reached an overbought RSI value above 80. After pulling back slightly, it moved to a higher high, but RSI set a lower high. The divergence between the two was a good signal that momentum was waning, and the trend could be near its end.
Math
RSI = 100 – 100/(1 + RS)
RS = Average of the up closes over n-periods
Average of the down closes over n-periods
The average of the “up closes” refers to the total changes higher over the past “n” periods (not the last “n” up-periods) divided by “n.” The average of “down closes” refers to the total changes lower over the same span.
RSI values are smoothed in an exponential manner after the initial calculation whereby the averages of up closes and down closes are each divided by n-1 and the new period’s up or down close is added. The result is then divided by n. As follows:
Average up close = (previous average up close x (n-1) + current up close) / n.
Average down close = (previous average down close x (n-1) + current down close) / n.
