Darvas Box
About Darvas Box
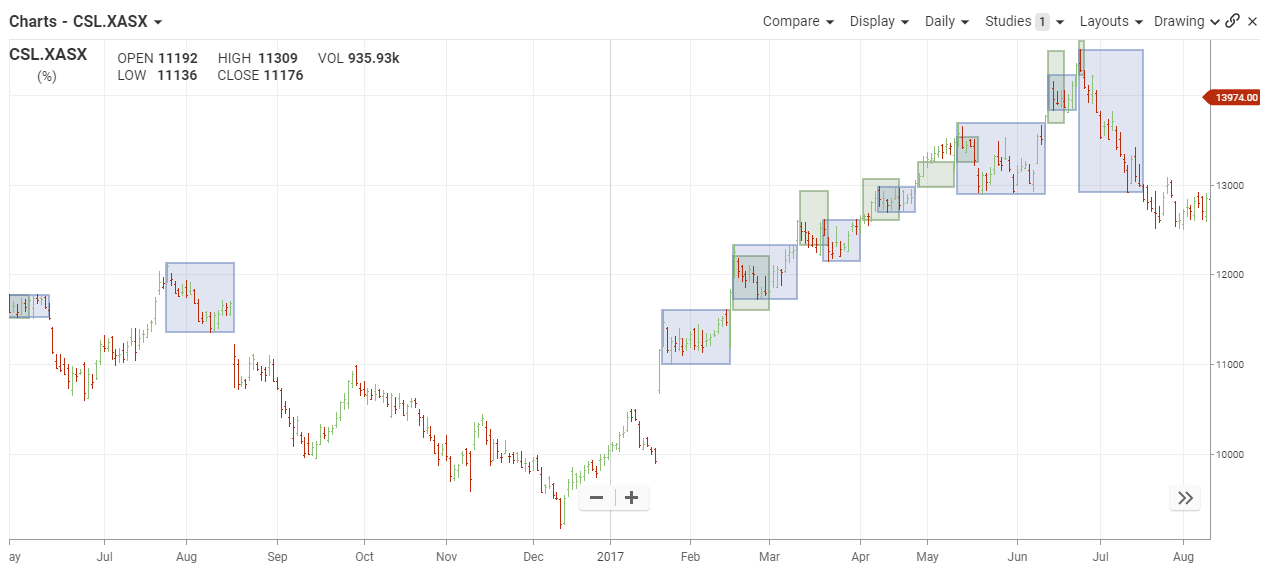
Based on the work of Nicolas Darvas, Darvas Box is essentially a support/resistance indicator and a trading methodology rolled into one. It is implemented as an overlay in Technician. While the indicator will run on any bar interval it is best used on higher intervals (i.e., weekly/monthly) with strong securities in a strong trend. The logic behind the construction of the Darvas Box is somewhat complex but the usage is straightforward. Once you have a closed box (a blue box assuming the default settings) you wait for a close (or a high) above the box on higher volume for a buy signal or a close (or a low) below the box on higher volume for a sell signal. The stop would generally be set just past the other side of the box. As new boxes form while you are in a trade you would add to the trade on new breakouts and the stop would also be trailed to the most recent box. When used strictly as an indicator, the Darvas Box is an excellent mechanism to identify trading ranges on all bar intervals.

Darvas Box running on a daily CSL chart.
A full discussion of Darvas theory as well as the various trading methodologies that have been formulated is beyond the scope of this document. Needless to say, there are numerous websites available that discuss Darvas theory in great detail and provide insights into successfully using Darvas in today’s markets.
