Aroon and Aroon Oscillator
The Basics
Used to identify the strength of a trend and especially when a trend is beginning.
Indicator Type
Trend Finder
Markets
All cash and futures, not options
Works Best
All market types and time frames although daily is the most popular.
Formula
The Aroon indicators are shown in percentage terms and fluctuate between 0 and 100. Aroon Up is based on recent highs and Aroon Down is based on recent lows. The Aroon Oscillator is simply a plot of Aroon Up minus Aroon Down.
Parameters
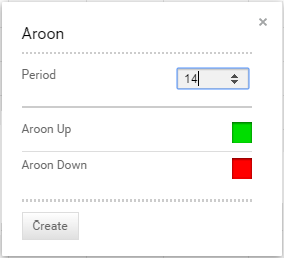
The most common parameter is 25. Technician defaults to a period of 14, which provides a quicker signal.
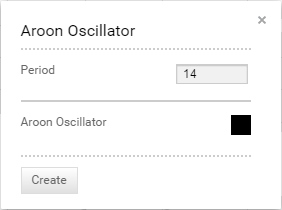
You can also select colour for the Aroon Up, Aroon Down and Aroon Oscillator plots by selecting the boxes next to each to bring up a colour palette.


Theory
“Aroon” means “Dawn’s Early Light” in Sanskrit, a name chosen for the indicator’s ability to spot the beginning of a new trend, either higher or lower. Developed by Tushar Chande, both the Aroon Up and the Aroon Down fluctuate between zero and 100, with high Aroon Up values indicating a strong rising trend. High Aroon Down values indicate a strong falling trend. Zero indicates a no trend. The main assumption underlying this indicator is that a stock’s price will close at relative highs in an uptrend, and relative lows in a downtrend.
A 25-day Aroon Up measures the number of days since a 25-day high. A 25-day Aroon Down measures the number of days since a 25-day low. This means the indicator analyses price relative to itself that than price relative to time, as many other indicators measure. It can spot emerging trends, identify consolidations, and anticipate reversals.
Interpretation
The Aroon indicators fluctuate above/below a centreline (50) and are bound between 0 and 100. These three levels are important for interpretation. Basically, the bulls are in charge when Aroon Up is above 50 and Aroon Down is below 50. The bears are in charge when Aroon Up is below 50 and Aroon Down is above 50.
A surge to 100 indicates that a trend may be emerging, and it is usually confirmed when the companion (Up or Down) declines. For example, a move to 100 in Aroon Up combined with a decline in Aroon Down shows upside strength. Consistently high readings mean prices are regularly hitting new highs or new lows for the specified period. Conversely, consistently low readings indicate that prices are seldom hitting new highs or lows.
Chande recommends the following signals:
Aroon Up above 70 indicates a strong uptrend.
Aroon Down above 70 indicates a strong downtrend.
Aroon Up below 50 warns that the uptrend is weakening.
Aroon Down below 50 signals that the downtrend is weakening.
The two moving lower near indicates consolidation, with no clear trend.
The Aroon Oscillator is a derivative of the indicator and provides a different way to view the results. It is constructed by subtracting Aroon Down from Aroon Up. The Aroon Oscillator oscillates between -100 and +100 with zero as the centre line. It signals an uptrend if it is moving towards its upper limit and a downtrend when it is moving towards the lower limit. The closer the Aroon Oscillator value is to either extreme the stronger the trend is.
A general bullish bias is present when the oscillator is positive, and a bearish bias exists when negative. However, unlike other oscillators, divergences between indicator and price are not meaningful.
Signals for the Aroon Oscillator:
Above zero signals an uptrend.
Below zero indicates a downtrend.
The farther away Aroon Oscillator is from the zero line, the stronger the trend.
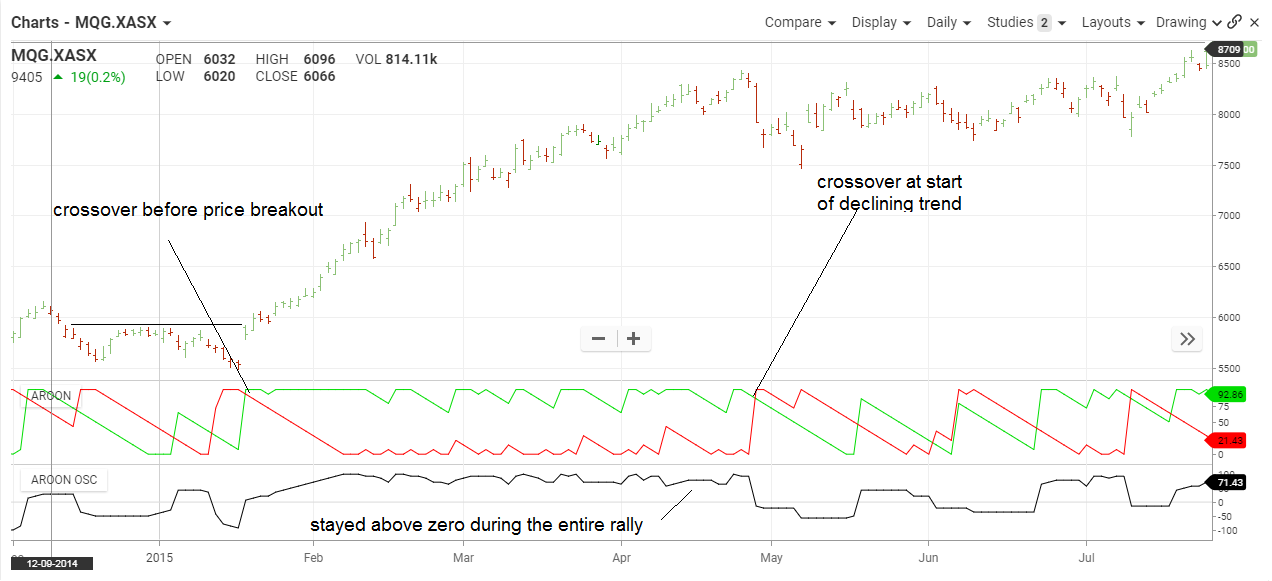
Macquaire stock started to pull back in early 2015 and we can see both Aroon indicators falling together. Both were below 50 in late January but two days before the breakout thought resistance, the Aroon Up crossed above the Aroon Down and made its way close to 100.
It was a good buy signal and as the Aroon Up stayed high while the Aroon Down stayed low the trade knew to hold that long position. Note how the Aroon Oscillator also stayed high.

Later, in April, the Aroon Down crossed above the Aroon Up to trigger a sell signal. The Oscillator also moved below zero.
Once again, the process was reversed in December to give a buy signal several days before the trendline was broken.
Math
Aroon Up = 100 x (n- Days Since n-day High)/n
Aroon Down = 100 x (n – Days Since n-day Low)/n
Aroon Oscillator = Aroon Up – Aroon Down
