Bollinger Bands®
The Basics
Bollinger bands are used to find market turning points, potential trading range breakouts, and trend exhaustion.
Indicator Type
Moving average envelope
Markets
All cash and futures, not options
Works Best
All market types and time frames although daily is the most popular
Formula
The bands form an envelope drawn many standard deviations above and below a moving average.
Parameters

20-period simple moving averages and 2 standard deviations are the recommended parameters. This results in bands that contain 85% of the underlying item’s prices. However, different intervals may require different average and deviation calculations. For example, analysts trying to gain perspectives on long-term periods may find 50-day means with 2.5 standard deviations optimal.
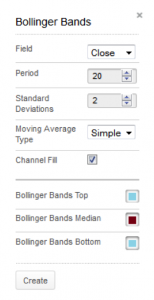
Technician defaults to a 20-period simple moving average of the close with the bands drawn at 2 standard deviations above and below the average.
You can select to fill in the bands to highlight them against the background of the chart or leave them hollow for a cleaner look.
You can also select colours for the upper, lower and middle lines by selecting the appropriate box to bring up a colour palette. The colour for the average (median) determines the colour for filled bands.
Theory
The theory behind the bands is that the width of an envelope should be determined by the data-series itself rather than by the assumptions of the speculator, as done with percent envelopes. In this way, the envelope’s distance from the mean is a function of the market’s volatility.
Interpretation
The key aspects are:
- Sharp moves tend to occur after the bands tighten to the average (volatility lessens). Volatility tends to cycle from high to low and back again, so a period of unusual calm often leads to an explosive move one way or the other.
- A move outside the bands calls for a continuation of the trend, not an end to it. Often, the first push of a major move will carry prices outside the bands. This indicates strength in an up market and weakness in a down market.
- A sharp move outside the bands followed by an immediate retracement of that move is a sign of exhaustion.
- Bottoms (tops) made outside the bands followed by bottoms (tops) made inside the bands call for reversals in trends.
- The bands can help in diagnosing double tops and bottoms, especially when the second part of the top (bottom) is higher (lower) than the first and lower (higher) in relation to the bands.
- The average should give support (resistance) in bull (bear) markets.
- A move originating at one band tends to go to the other band in consolidating or ranging markets. This is useful for projecting price targets early on and provides revised targets as events unfold.

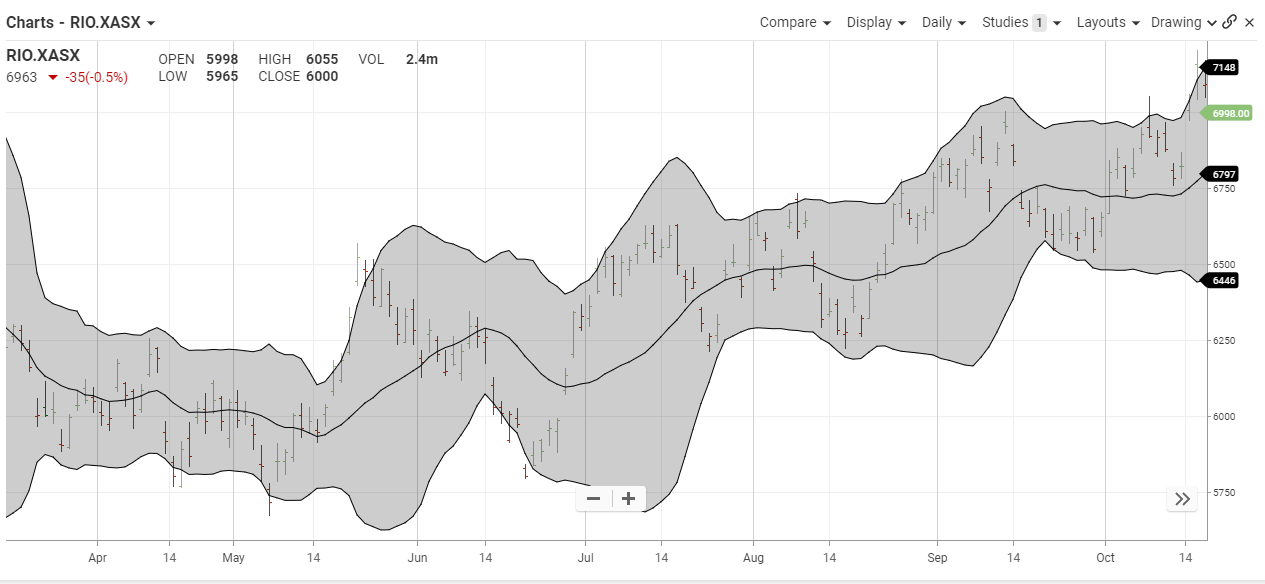
Above is a daily chart of Rio for one year. Note how the 20-day moving average provided loose support and resistance for each short-term trend. Also note how most of the time, all trading is contained within the bands.
When prices move outside the bands, the following analysis can be applied:
- Sharp moves after a relatively calm market tend to occur after the bands tighten to the average (volatility lessens). In August and September 2016, the bands became quite narrow and that was followed by a quick burst higher.
- Reason — market participants have slowed their activities and are waiting for the market to tell them where it is heading. Once a move starts, everybody jumps in.
- A move outside the bands calls for a continuation of the trend, not an end to it.
- Reason — volatility has not expanded yet to compensate for the new trend. Other indicators, such as RSI, can confirm this.
- Lows made below the bands followed by lower lows made inside the bands call for an upside reversal in trends. Note how Tesla made a new low in September 2016 outside the bands while the next price trough occurred inside the bands. The result was a sharp, albeit short-lived rally.
- Reason — market participants have not accepted the increase in volatility and therefore look for wide price swings to take profits
Math
An envelope based with width determined by standard deviations above and below a moving average.
- Middle Band = N-period moving average
- Upper Band = N-period moving average + (N-period standard deviation of price x multiple)
- Lower Band = N-period moving average – (N-period standard deviation of price x multiple)
Multiple = user defined number of deviations above and below middle band (typically 2.0)
N-period = typically 20
Standard Deviation =
- Calculate the average (mean) price for N periods
- Subtract each price over N periods from the average price over N periods
- Square each difference.
- Sum these squares
- Divide this sum by N
- Standard deviation = the square root of that number.
