Pitchfork (Andrews Pitchfork)
The Basics
The Andrews Pitchfork is also known as median lines and is used to find areas of support and resistance within a trend.
Indicator Type
Trend channel identifier
Markets
All cash and futures, not options
Works Best
Trending markets.
Formula
n/a
Parameters
n/a
Theory
A rising market bounces up off its supporting trendline and a falling market bounces down off its resisting trendline. In the former case, the trendline provides a buying point at each bounce. If this market is still trending higher (i.e. – does not break its trendline) there is no signal given as to when to sell to lock in profits. By drawing a parallel line to the trendline a channel can be created which contains all short-term rallies and declines within the general trend. The lower trend line can be used to buy into the rally and the top trend line can be used to take short term profits. After selling, the trader would then wait for the market to hit the bottom trend line to buy again.
Drawing the parallel line can often be more subjective than we would like because most of the time markets do not trade up and down in neat compartments. There often is market “noise” (volatility) and overlapping short and long-term cycles that make trading appear irregular. To better measure a trading channel, the Andrew’s Pitchfork can help by building it around real, objective market activity. This is activity is often a counter-trend move (retracement). The Pitchfork gets its name from its appearance of a three-pronged fork and a long handle (median line).
Just as with horizontal support and resistance levels, markets trade within one range, then move to another, similar range and back again. The Pitchfork measures a larger trading channel and its two major, and equal, sub-channels. It is common for a market to trade in the lower channel, jump to the upper and then back to the lower. During all this activity, the general trend is still intact. When prices move outside of the larger channel, the overall market trend may have changed.
The Fibonacci Connection
Pitchforks can also help identify trading channels before simple parallel trendline drawing can. By using an already established market move (retracement) as the width of the channel, the median and parallel lines can be constructed, giving the trader early targets for short term trading within the new trend. These market retracements generally occur at Fibonacci levels, so a pitchfork is almost Fibonacci on an angle.
Interpretation
The double channels of the Andrew’s Pitchfork serve to identify a longer-term trend at the same time as the shorter-term trend. As long a counter-trend moves are smaller than the double channel width, the primary trend will remain intact. Trading from one sub-channel to the other may present short term trading opportunities but breakouts from the combined channel may indicate true trend changes. The latter should be combined with simple trendline analysis for a more reliable signal.

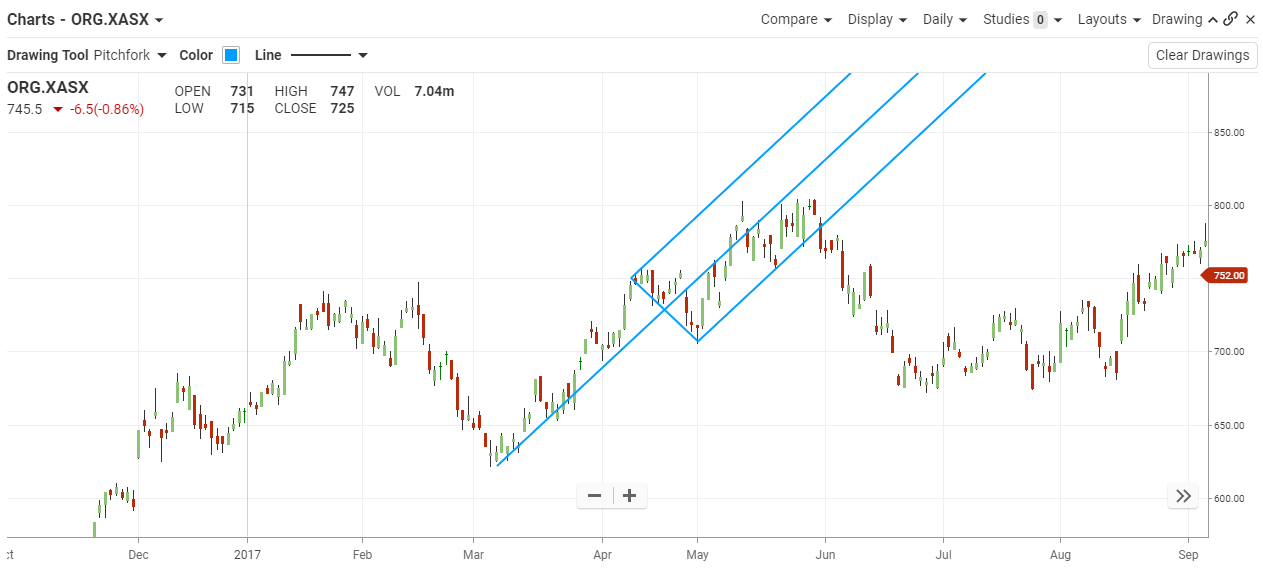
Here we see origin Energy establish a new rising trend in March 2017. In April 2017, it underwent a sharp correction, or pullback. Begin the pitchfork construction at the start of the rally. Then click or tap the start of the correction and click or tap the bottom of the correction. The median line draws from the origin (the low) through the middle of the line connecting the start and finish of the correction – bisecting it.
The parallel channel lines contain most of the continued rally. Most of the tine, price stayed in the lower half and some may interpret that is a leaning towards weakness. However, there is no signal that the trend is over until the lower channel line is broken to the downside.
Sometimes the median line needs adjusting to establish a realistic slope. Pitchforks that are too steep will be easily broken. Pitchforks that are too flat will not capture the trend
Math
There is no formal formula. The user selects the start point and the high and low for the countertrend move. A line emerges from the start point to bisect the line between the high and low selected.
