Donchian Channel
The Basics
The Donchian Channel helps identify volatility, but its primary use is to trigger long or short trades. Also used to automatically locate support and resistance.
Indicator Type
Trend following indicator
Markets
All cash and futures, not options
Works Best
All market types and time frames. Since this is a trend following system it would be beneficial to also use a trend filter such as a moving average crossover or directional index to identify to the trend.
Formula
The channel is formed by taking the highest high and the lowest low of the prior n periods.
The median line is the average of the upper and lower band for each period and not a moving average of price.
Parameters

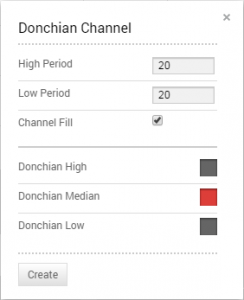
The indicator was created to track one month of data, so a 20-period parameter was the original. Technician defaults to this period in all time frames for both the high and the low. Change either or both by entering it in the box.
Check the “channel fill” box to shade the area between the bands. Shading colour is based on the median line colour.
You can also select colour for each line by selecting the boxes next to each to bring up a colour palette.
Theory
The Donchian channel is a useful indicator for quantifying volatility. If price is stable the channel will be relatively narrow. If price is volatile will be wider.
Its primary use, however, is for providing signals for long and short positions. If a security trades above its highest n periods high, then a long is opened. If it trades below its lowest n periods low, then a short is opened.
Theoretically, new highs lead to even higher prices as trends progress. That is why it is important to confirm that a trend is in place. During trading ranges, new highs are overbought signals.
Interpretation
The channel is based on the concept that a new high should be bought, and a new low should be sold. In addition, after a channel break, the new high then becomes support and the new low becomes resistance.
Traders buy a new high and hold until one of three events occur: 1) the upper band is negated, 2) price moved through the lower band, price moves through the median line or 4) a traditional stop is hit. This is based on preference and aggressiveness of the trader but choice 2) is most common.
When price closes above the channel, buy long and cover short positions. When price closes below the channel, sell short and liquidate long positions. Use a trailing stop for exits or wait for a cross of the opposite channel line.

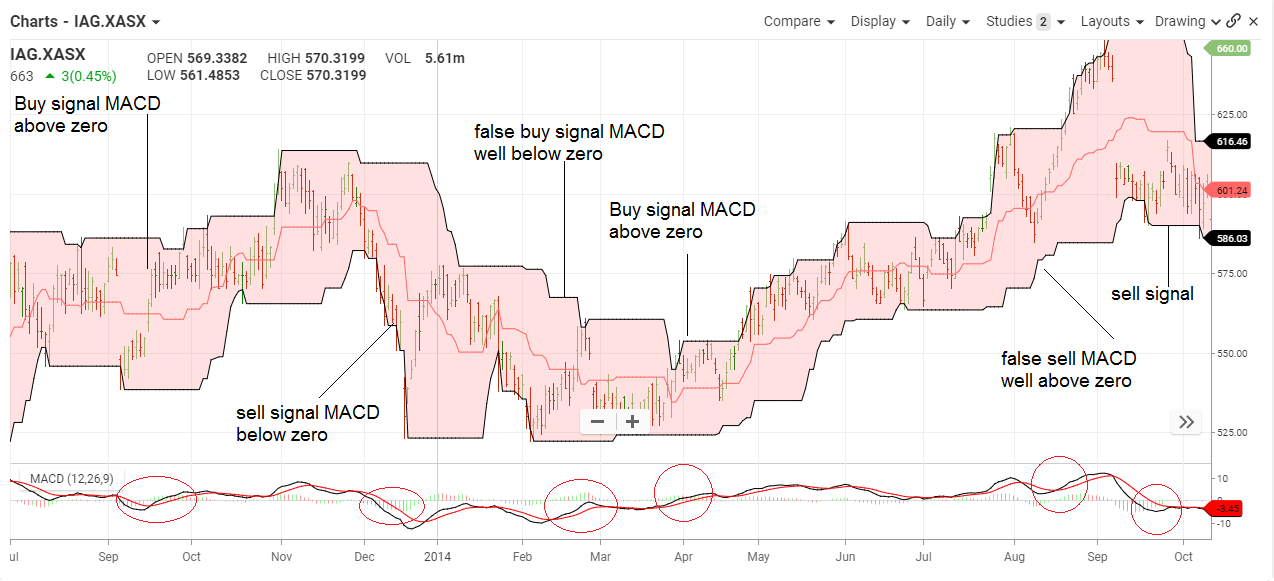
This chart shows IAG as 2014 opened in a relatively flat range as the channel was very narrow. MACD was above zero so we give the bias to the upside so small violation of the lower channel line was a false signal.
A short while later price moved through the upper channel line with positive MACD and slightly wider bands. That turned out to be a good but not great buy signal because it turned in December a sell signal was generated with a violation of the lower line and negative MACD.
The rest of the chart shows similar events until March when the stock jumped sharply on news. Often, this can be a short-lived reaction and an overbought stock sinks back down, possibly all the way to the breakout point.
However, in April its broke the zero and once the stock proved it could stay high, it made another new high for a more conservative buy signal. It continued to flash buy signals as the trend developed further. Of note, the August pullback did not violate the median line, let alone dip below the lower line so there was no stop generated. Then in September it strong crossed under the zero MACD and triggered a sell signal.
Math
1) Directional Movement (DM) is defined as the largest part of the current period’s price range that lies outside the previous period’s price range.
- PDM = current high minus the previous high (called plus DM)
- MDM = current low minus the previous low (called minus DM)
- If PDM > MDM then MDM is set to zero
- If MDM > PDM then PDM is set to zero
- If current range lies within or is equal to the previous range, then set both PDM and MDM to zero
2) Calculate the value of the Plus and Minus Directional Indicators:
PDI(n) = PDM(n) * 100 MDI(n) = MDM(n) * 100
ATR(n) ATR(n)
Where: n = Number of periods
ATR = Average True Range
3) Calculate the absolute value of the Directional Movement Index (DMI):
DMI = (PDI – MDI)
(PDI + MDI)
4) Calculate the Average Directional Movement (DMIA a.k.a. ADX):
DMIA(n) = Simple Moving Average of DMI
