Alligator and Gator Oscillator
The Basics
Used to differentiate between trending and resting periods
Indicator Type
Trend following indicator
Markets
All cash and futures, not options
Works Best
All market types and time frames but is more effective when combined with a momentum indicator.
Formula

The indicator uses three smoothed moving averages, each one offset forward (into the future).
Parameters
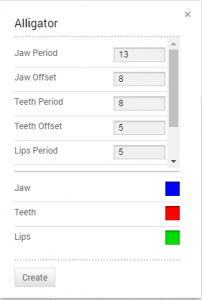
Creator Bill Williams used 13, 8 and 5-period averages, brought forward 8, 5 and 3 periods, respectively. Colours are usually blue, red and green, respectively.
Technician defaults these parameters, but you can change any and all of them by editing the corresponding values in the box.
You can also select colour for the plots by selecting the boxes next to each to bring up a colour palette.
Theory
The indicator consists of three lines, overlaid on a price chart, that represent the jaw, the teeth and the lips of the alligator. It was designed to help confirm that a trend is in effect and in what direction. As with all moving averages, the shortest one (green) moves first, followed by the middle (red) and then longer average (blue).
The longer the period of sleep the better the wake-up signal becomes. The trade is held until the middle red line is crossed again. The Gator Oscillator presents the data in a different format to help with interpretation. It is a histogram that plots the absolute distance between the red and green averages. Expanding green bars mean the averages are widening and the trend is stronger. Contracting red bars mean the averages are narrowing and the trend is slowing or stopping.
If the three lines are entwined, then the alligator’s mouth is closed, and he is said to be sleeping. The Gator Oscillator alternates between green and red bars. Supposedly, during sleep the alligator gets hungry, waiting for a breakout from his sleep so he will eat. When the trend begins, the Alligator wakes and starts eating. The Gator Oscillator shows large green bars. Once full, the alligator closes his mouth once again and goes to sleep. Red bars appear on the Gator Oscillator.
The alligator returns to sleep and bars on both sides of the Gator oscillator are red.
Interpretation
According to the indicator’s creator, trends may only occur 20-30% of the time so alligator helps a trader wait for a valid trend to begin. Once the trend forms, the alligator helps the trader remain in his position.
The key points of reference are when the lines are entwined, when they are “open”, and when the red and green lines cross. When entwined, patience is the key. When the lines are apart, stay long if the price bars stay above the averages. Stay short when they stay below the averages.
When the lines converge or cross, it is time to consider exiting, although a momentum indicator will help zeroing in on a better exit place. A MACD, for example, crosses the zero line.
Long Trade Signal
- Green line above red line
- Red line above blue line
- Bullish two-bar reversal
Short Trade Signal
- Green line below red line
- Red line below blue line
- Bearish two-bar reversal
Meanings
- Gator sleeps – the bars on different sides of the naught line are colored differently.
- Gator eats – green bars on both sides of the zero line.
- Gator fills out – red bars appear during the “eating” phase.
- Gator goes to sleep – the bars on both sides are red

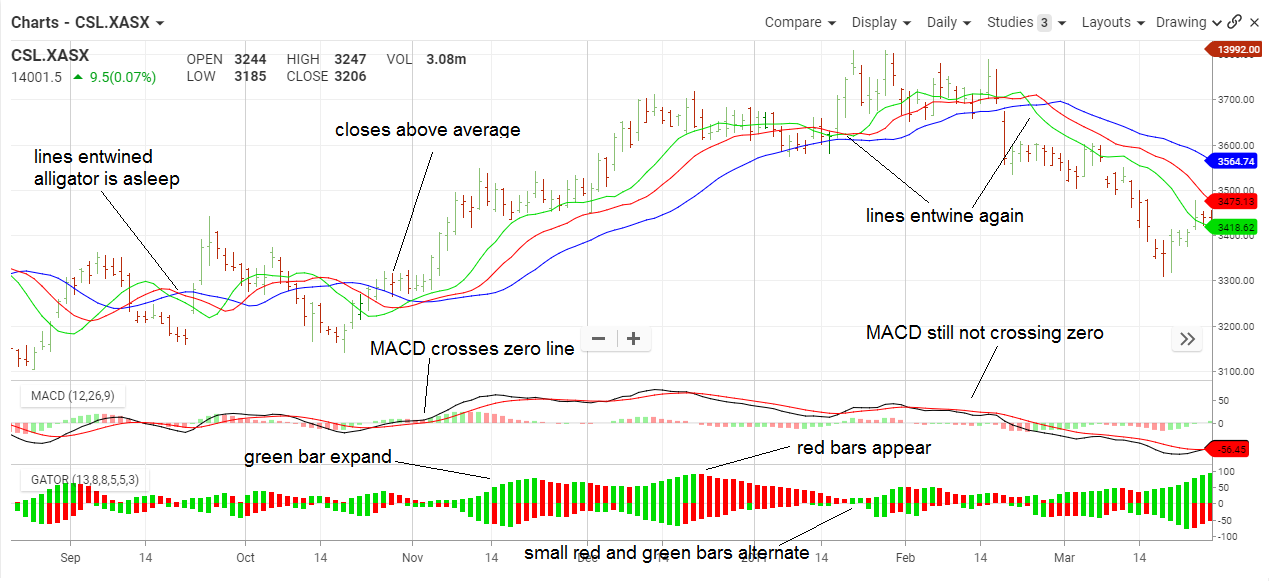
In this chart, the Alligator went to sleep in September 2014 as the lines were entwined. The Gator Oscillator alternated small red and green bars. In October, price closed above the indicator and MACD crossed the zero line but the oscillator did not show green bars on both sides of its zero line until early November. That was the buy signal.
The long trade was held for several months. Arguably, it could have suffered a whipsaw in late November but green bars in the oscillator argued to hold it long. But even if whipsawed, the trade was back on in early December with expanding green bars.
In January, red bars appeared in the oscillator suggesting time to lighten up. It was not until January when lines again became entwined and red bars appeared on both sides of zero in the oscillator for a full exit signal.
There was no sell signal to initiate short trades.
Math
Calculate three moving averages and offsets them into the future.
- The Jaw line a 13-period Smoothed Moving Average (SMMA), moved into the future by 8 bars;
- The Teeth line is an 8-period Smoothed Moving Average (SMMA), moved by 5 bars into the future;
- The Lips line is a 5-period Smoothed Moving Average, moved by 3 bars into the future.
Smoothed Moving Average – Same calculation as an exponential moving average except the smoothing constant is different.
P + wP1 + w2P2 + … + w(n-1)P(n-1)
1 + w + w2 + … + w(n-1)
Exponential smoothing constant: 2/(n+1)
Wilder smoothing constant: 1/n
Therefore, the Wilder average reacts slower than an exponential average. Also, the Wilder average can be converted into an exponential average with the formula 2n-1. For example, a 26-day Wilder average will draw the exact same plot as a 51-day exponential average.
