Stochastic Momentum (SMI)
The Basics
Stochastic Momentum is a variation on the original stochastic indicator used to find overbought and oversold conditions.
Indicator Type
Momentum oscillator
Markets
All cash and futures, not options
Works Best
Flat markets or trading ranges
Formula
The calculation tells us where price with regard the median of its recent range and runs a smoothing average through the result.
Most traders smooth the smoothed line again to create a slower version of the indicator.
Parameters

Most traders and markets use a period of 14 although 9 period and 20 period values are used to make the values more or less sensitive, respectively.
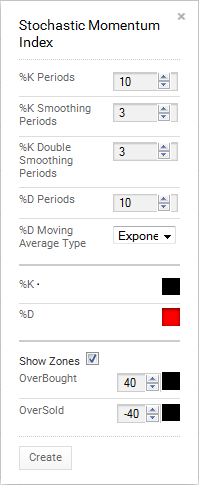
The default is to a period of 10 with 3-period smoothing in both fast and slow versions.
The “Show Zones” box allows the user to draw overbought and oversold zones on the plot. They default to 40 for overbought and -40 for oversold but can be changed by the user.
You can also select colour for the stochastics plot (basic and smoothed and slow) and two zone lines by selecting the boxes next to each to bring up a colour palette.
Theory
The SMI is supposed to be an improvement over the traditional stochastic oscillator in that not only does it smooth the raw value of the indicator but also smooths the changes of the range itself.
The SMI has a normal range of values between +100 and -100. When the present closing price is higher than the median value of the high/low range, SMI is positive. When current closing price is lower than the midpoint of the high/low range, the SMI is negative.
A stochastic is the measurement of the placement of a current price within a recent trading range. The theory is that as prices rise, daily (or hourly, minute, etc.) closes tend to occur closer to the high end of their recent range. When prices trend, higher or are flat and daily closes begin to sag within the range, it signals internal market weakness.
Interpretation
Values above 40 or below -40 are potential market signals. Aside from smoothing out fluctuations, the moving average adds two other dimensions to the analysis. Crossovers between the two lines and divergences between the stochastic and the price trend, both within the overbought and oversold ranges, provide additional evidence of reversals in the market.
The stochastic will tend to show many crossovers and therefore could show false signals to the inexperienced user of this technique. The smoothed version, often called the slow version, will show fewer crossover signals, but each one is more likely to catch true near-term market reversals. One caution would be that extreme readings in strongly trending markets could be continuation, not reversal, signals. This study is better suited to slower market conditions.

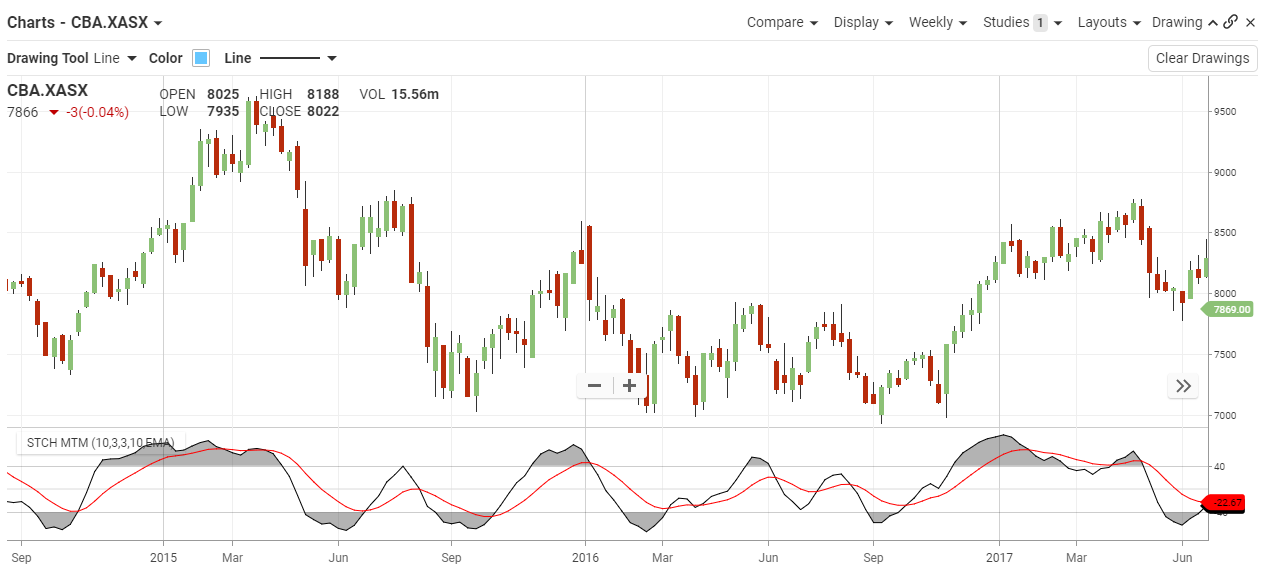
Commonwealth Bank was very choppy in 2015-2016 so a trading range indicator such as SMI should be applied. Here, we see short-term sell and buy signals that went against the short-term trends when SMI moved to extremes.
Note that during the rising trend in mid 2015, SMI registered overbought conditions but not oversold. This information helps us understand that a trend is in place.
Arguably, there was a bullish divergence before this trend got underway as SMI made a higher low as prices made lower lows.
