Parabolic SAR
The Basics
Parabolic SAR (Stop-and-Reverse) is used to set stop prices and automatically trail them with the trend.
Indicator Type
Trend following system
Markets
All cash and futures, not options
Works Best
Trending markets
Formula
The initial SAR (stop and reverse point) is set at the end of the previous trend. For new rising trend, to calculate the next SAR, the acceleration factor is multiplied by the difference between the current high for the new trend and the prior period’s SAR. This is then added to the prior period’s SAR.
Parameters

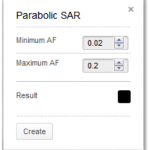
The minimum acceleration factor is usually set at .02. Each time the trend makes a new high or low the acceleration factor is increased by .02, usually to a maximum of .2. In other words, the stop is raised by 2%, increasing gradually to a maximum of a 20% increase.
You can also select colour for the parabolic plot by selecting the result box to bring up a colour palette.
Theory
The Parabolic Time/Price System is a trading system that calculates stop and reverse values as a function of price and time. When a position is initiated, the stop is set at a price above or below current action based on previous price swings. The stop is then moved in the direction of price activity based on an accelerator formula. This allows a new trend to become established without stopping out correct positions due to the normal volatility associated with changes in trend.
When the price action turns and hits the trailing parabolic stop, the position is reversed, and a new stop is calculated. The point at which the position is reversed is called a stop-and-reverse (SAR). The system is always long or short, never neutral.
Interpretation
Parabolics employ trailing stops that are initially set loosely and then tightened exponentially. This exponential smoothing factor causes the stop points to take on a parabolic shape as they get closer to the price action. Having a maximum acceleration factor ensures that the SAR is not so tight that normal market wiggles (volatility) cause false signals.
The stronger the trend, the better parabolic SAR works. It is often employed trend quantifying tools such as moving average systems or the Welles Wilder Average Directional Index.

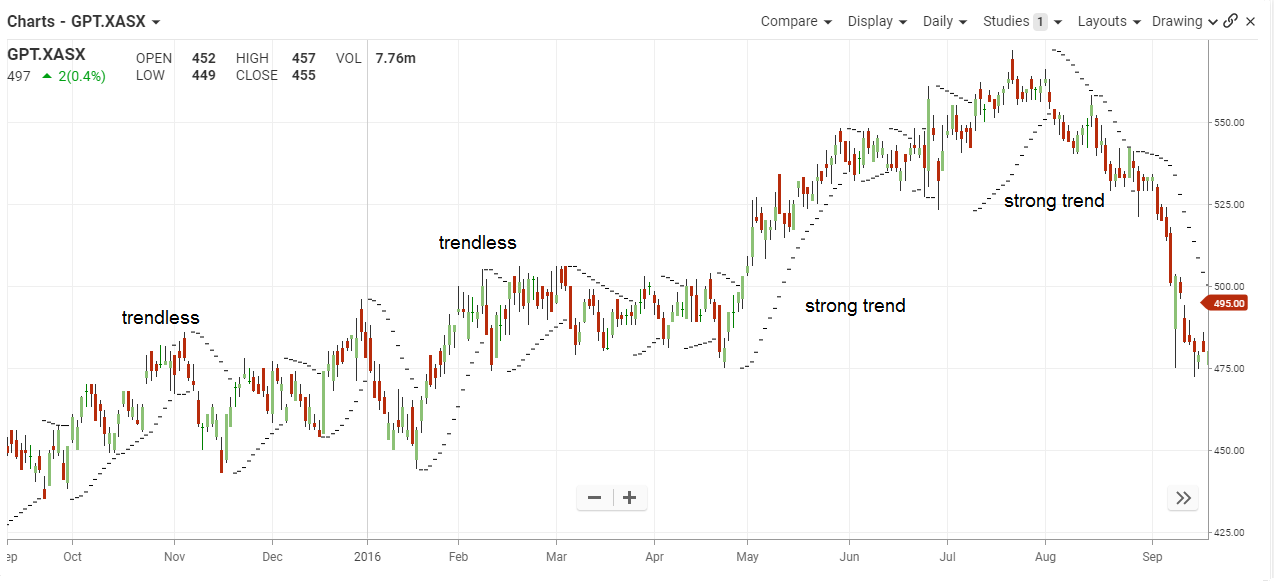
GPT moved sideways in October 2015 and the stop-and-reverse was triggered resulting in many whipsaws. The same occurred several months later even though the trend was mostly rising. However, it was not very strong.
The stock started to rally a bit more steadily in April 2016 and did not trigger the SAR. It then exploded higher, keeping the long position intact. Finally it stalled in August, triggered the stop and locked in good profits before the stock moved sideways to lower over the next month.
Math
The initial SAR (stop and reverse point) is set at the extreme price of the previous trend. After the initial SAR is set, the next interval’s SAR is adjusted in the direction of the trend by the distance between the high for the new trend and the previous SAR then multiplied by an acceleration factor. The acceleration factor typically starts at .02 and increases by .02 to a typical maximum of .20 each period the market makes a new high/low for the move.
For a rising trend:
- Previous SAR: The SAR value for the previous period.
- Extreme Point (EP): The highest high of the current uptrend.
- Acceleration Factor (AF): Starting at .02
Current SAR = Previous SAR + Previous AF(Previous EP – Previous SAR)
When price moves through the SAR point, the entire calculation starts over, but the extreme point becomes the lowest low of the new trend and the AF becomes a negative number.
Current SAR = Previous SAR – Previous AF(Previous EP – Previous SAR)
