SuperTrend
The Basics
Used to time buys and sells based on changes in the trend
Indicator Type
Trend following indicator
Markets
All cash and futures, not options. Most popular in forex
Works Best
Trending markets
Formula

The upper band is the average price plus the volatility-based multiplier (usually average true range (ATR)). The lower band is the average price minus the volatility-based multiplier. Only one band is drawn for any period and it switches when price crosses it similar to the parabolic stop-and-reverse.
Similar to any trailing stop, the upper band can never move higher once established and the lower band can never move lower once established. Each is continued at the same price level as the previous period.
Arrows are drawn pointing to the close of the bar when direction changes.
Parameters
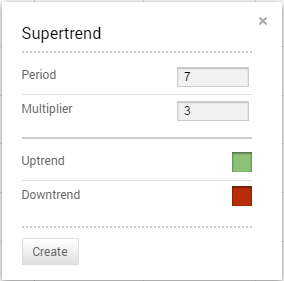
The typical period used for the ATR calculation is 7. The multiplier is typically set at 3. Technician defaults to these parameters.
You can also select colours upper and lower lines by selecting the appropriate box to bring up a colour palette.
Theory
The supertrend indicator measures trend direction but not strength. It gives buy or sell signals when price crosses the indicator. In a sense, it is like a moving average and trailing stop hybrid. Since the indicator flips sides from above to below price action and back it adds an element of the parabolics stop-and-reverse for making the trade.
Because it measures trend, it is not useful during flat or choppy markets.
Interpretation

Once a down trend, for example, is established, the upper supertrend line will trail it lower as would a moving average. There will not be a lower supertrend line at this time.
Conversely, in a rising trend, the lower line will trail price higher and there will be no upper line. The opposite line appears only when price crosses the current line. And at that same time the current line will stop.
The difference between the supertrend and a moving average envelope is that it accounts for volatility and can never move in the opposite direction. Interpretation is simple. Buy when the current period closes above the upper line. Sell when the current period closes below the lower line.
The trader can adjust the multiplier to tighten it for less volatile markets and widen it for more volatile markets.
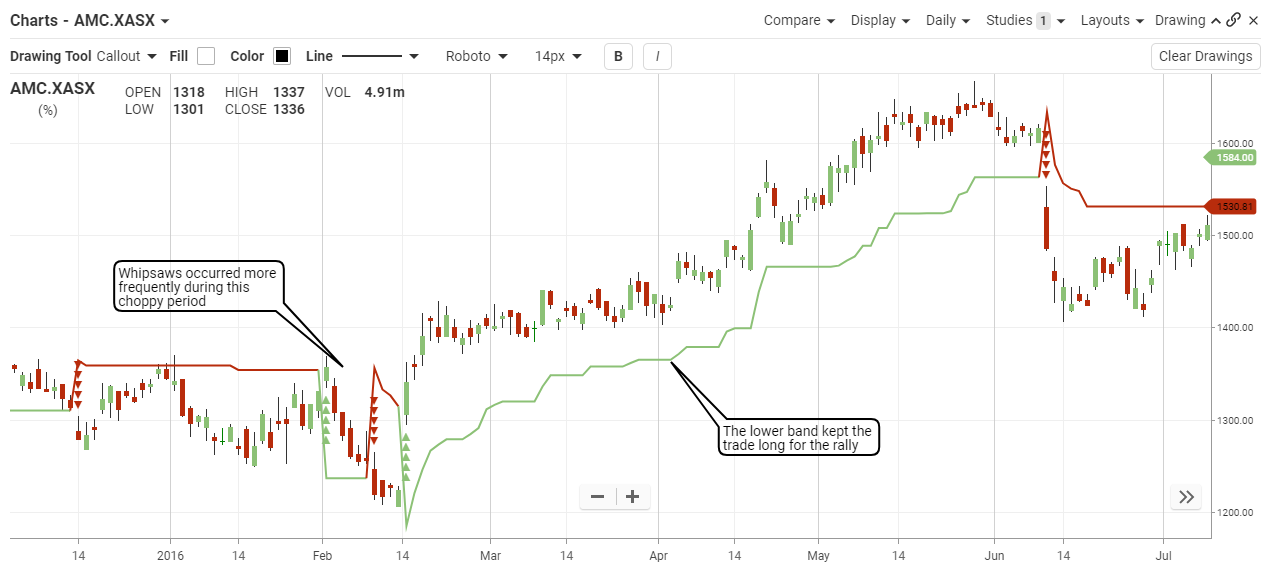
The chart of Amcor shows a choppy period of trading in February 2014 that gave many supertrend false signals. In order to know about this condition, a trend identification indicator such as the Directional Movement System could be used. However, we can still eyeball that the market was rather choppy at that time.
In the middle of the chart, the trend was established (we can use a trend line or support break to identify it) and a long position should be taken. Supertrend kept the long until just after the ultimate high and then flipped to a short. We can see how the green line below changed to a red line above.
Math
Supertrend
Upper = ((high + low / 2) + Multiplier * ATR …Only if price < upper
Lower = ((high + low / 2) – Multiplier * ATR …Only if price > lower
ATR (Average True Range)
TR (True Range) is defined as the greatest of the following:
- Current high minus the current low
- Current high minus the previous close (absolute value)
- Current low minus the previous close (absolute value)
ATR = simple moving average of TR
