Bollinger %B
The Basics
%B finds the position of a security within Bollinger Bands. It is used to quantify what could be subjectively identified by eye.
Indicator Type
Momentum Oscillator
Markets
All cash and futures, not options
Works Best
All market types and time frames although daily is the most popular.
Formula
Bollinger Bands form an envelope drawn many standard deviations above and below a moving average. %B is simply a percentage measure of a security’s location between the bands. %B can be lower than 0 or higher than 100 if price moves outside the bands.
Parameters

20-period simple moving averages and 2 standard deviations are the recommended parameters. However, different intervals may require different average and deviation calculations. Typically, %B parameters will match the user’s preferred Bollinger Band parameters.
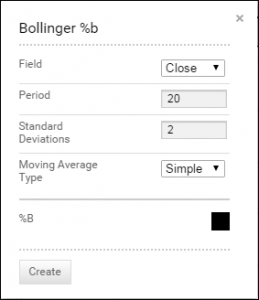
Technician defaults to a 20-period simple moving average of the close with the bands drawn at 2 standard deviations above and below the average.
You can also change colour for the plot by selecting the box to bring up a colour palette.
Theory
The theory behind the bands is that the width of an envelope should be determined by the data-series itself rather than by the assumptions of the speculator, as done with percent envelopes. In this way, the envelope’s distance from the mean is a function of the market’s volatility. Knowing exactly where price is within the bands creates a more objective analysis.
Interpretation
See the Bollinger Bands document in the resource centre for more on the bands.
%B near or above 100 can suggest an overbought market. Conversely, near or below 0 can be oversold. However, extreme readings are not necessarily indicative of turning points. In a rising trend, prices will tend to hug the upper band so %B can remain at very high levels, including above 100, without pointing to a reversal.
The opposite is true for declining trends therefore it is a good idea to supplement the reading with either a visual inspection of the trend or another indicator that measures trend strength or momentum.
Divergence analysis can be a better method. For example, if %B moves above 100 and then price sets a higher high but %B peaks back below 100 it could be a sign of exhaustion.

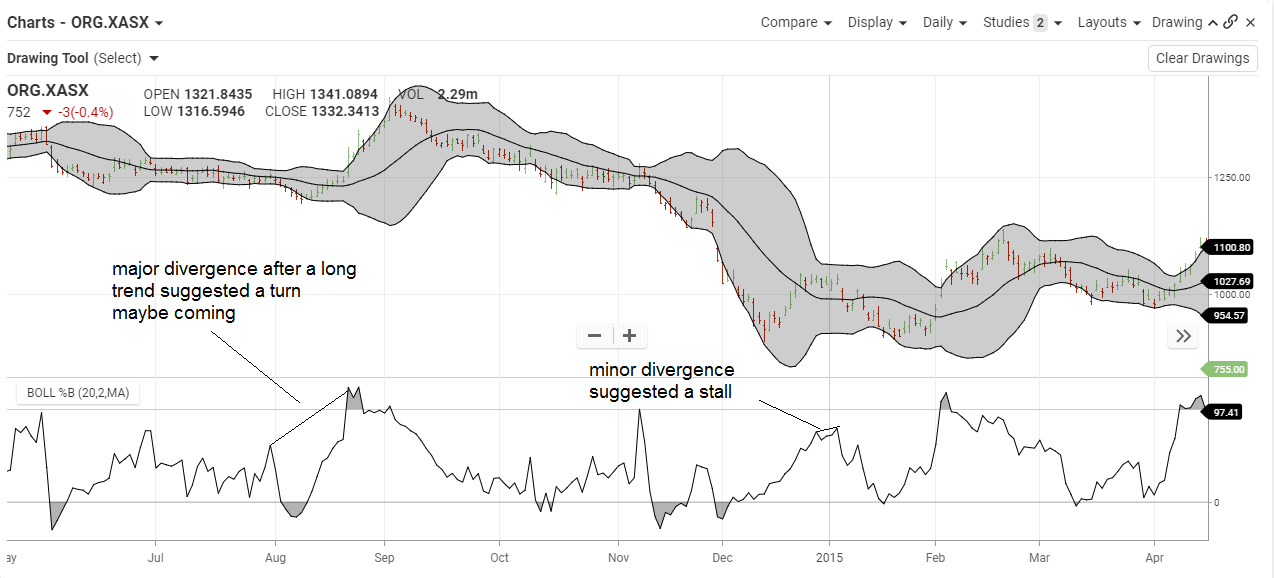
Above is a daily chart of Origin with 20-period, 2 standard deviation Bollinger Bands. Below is the %B indicator with the same parameters. While it is possible to visually find divergences between indicator and price action, the %B makes it very easy. And it makes it possible to quickly find major vs. minor divergences.
After the major divergence the ETF soon ended its bull run. After the minor divergence, which followed a smaller, possibly counter-trend advance, the ETF merely stalled.
Note that afterwards, the Bands flattened out until %B dropped below 0. That signalled a new leg lower had begun.
Math
%B = (Price – Lower Band) / (Upper Band – Lower Band)
