Cumulative (On-Balance) Volume
The Basics
Cumulative volume (or on-balance volume) is used to confirm market moves based on buying and selling pressure.
Indicator Type
Volume study
Markets
All cash and futures, not options
Works Best
Active markets, usually in daily time frame
Formula
Cumulative total of daily volume on up days minus daily volume on down days. Each day’s volume may also be weighted by the price change for that day so that volume on days with large price moves is counted more heavily.
Parameters

There are no parameters to set but you can select colour for the plot by selecting the result box to bring up a colour palette.
Theory
On-balance volume is also known as Cumulative Volume. Supply and demand can be measured by the volume taking place on price increases (up periods) and the volume taking place on price decreases (down periods). Over time, cumulative volume and price should rise and fall in tandem.
Interpretation
On its own, cumulative volume does not provide many clues for predicting prices, but used with price chart, its usefulness becomes apparent. Divergence between the two may signal trading opportunities.

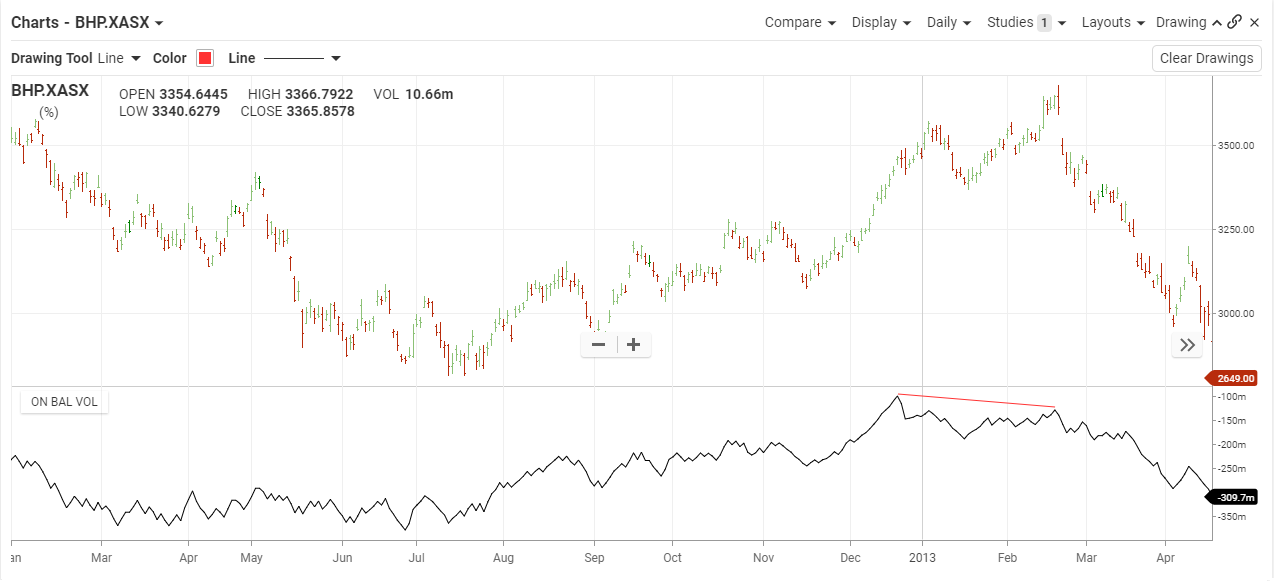
BHP rallied nicely in late 2012 and on-balance volume reflected the same path. However, in December 2012 on-balance volume started top decline. The divergence between price and indicator suggested caution and in February the run broke down.
Math
A running total of volume on up-periods minus volume on down periods. Periods with no change have no effect.
∑volume * (direction of price change )
Value will change depending on span chosen but plot will look the same.
